

Millions of people wake up each morning and check their watch or ring for a sleep score. But how accurate is that breakdown showing your deep sleep, rem sleep, and light sleep percentages? Understanding wearable sleep stage accuracy matters because the data you’re seeing is an estimate, not a diagnosis.
This guide breaks down what your sleep tracking devices actually measure, how they compare to the gold standard, and what you should do with all that sleep data.
Executive Summary: Wearable Sleep Stage Accuracy
Consumer wearable devices have advanced significantly, but they remain approximations compared to clinical standards. Here’s what the research shows:
Typical accuracy ranges:
- Sleep-versus-wake detection: 92-98% for top devices
- Overall sleep staging agreement: 75-82% in rigorous testing
- Stage-specific accuracy varies widely by stage and device
Main limitations versus polysomnography:
- Reliance on indirect proxies (movement and heart rate) rather than direct brain activity measurement
- Cohen’s kappa values typically fall between 0.5-0.7 for multi-stage classification
- Light sleep commonly overestimated, deep sleep underestimated
- Rapid eye movement detection challenged by phasic eye movements and variable heart rate changes
User groups who benefit most:
- Healthy adults seeking trend insights over weeks and months
- Athletes tracking recovery via heart rate variability correlations
- Individuals with consistent schedules looking to optimize sleep patterns
Wearables work best as trend trackers for generally healthy people, not as tools to diagnose sleep disorders.
How Sleep Trackers Estimate Sleep Stages

Wearable sleep stage accuracy – executive summary: wearable sleep stage accuracy
Your sleep tracker doesn’t actually see your brain waves. Instead, it uses three core technologies working together.
Actigraphy (movement-based detection): Originating from 1970s clinical tools, accelerometers sample your body movements at 25-100 Hz. The algorithm classifies periods of immobility as potential sleep onset after epochs of low variance. The limitation? Quiet wakefulness looks identical to sleep when you’re lying still.
Photoplethysmography (PPG): Those green or infrared LEDs on your device measure blood volume changes to calculate heart rate and heart rate variability. High-frequency HRV suggests light sleep stages. Low heart rate with high amplitude variability signals slow wave sleep. Irregular patterns indicate REM.
Machine-learning classification: Modern devices use convolutional neural networks or random forests trained on labeled polysomnography datasets. Advanced algorithms, including AI-powered systems, analyze multimodal physiological data to improve wearable sleep stage accuracy and provide more detailed sleep stage analysis. They process multi-channel time-series data in 30-second epochs to output probabilities for wake, light, deep, and REM stages. Recent 2026 updates from Apple, Fitbit, and Oura incorporate transformer models for better temporal context.
Accelerometers, PPG, and Other Sensors
Understanding what sensors your device contains helps you interpret its limitations.
| Sensor | What It Measures | Sleep Staging Role |
|---|---|---|
| Tri-axial accelerometer | Acceleration in mg units | Quantifies immobility (thresholds < 5 mg/s for sleep) |
| PPG | Inter-beat intervals | HRV metrics like RMSSD (typically 20-60 ms in sleep) |
| SpO2 (pulse oximetry) | Blood oxygen levels | Detects apneas, rarely used for staging |
| Skin temperature | Nocturnal temperature changes | Correlates with sleep onset (0.5-1°C decline) |
Device-specific differences matter. Whoop 5.0 samples PPG at 26 times per second for finer granularity. Oura Ring 4 employs red and infrared LEDs optimized for finger placement, outperforming wrist-based devices in low-light conditions.
Modern sleep trackers offer many functions, monitoring not only sleep stages but also other aspects of health and activity, such as heart rate, blood oxygen, and movement patterns.
Gold Standard: Polysomnography and Sleep Architecture
Polysomnography (PSG) remains the gold standard for measuring sleep since the American Academy of Sleep Medicine established criteria in the 1930s.
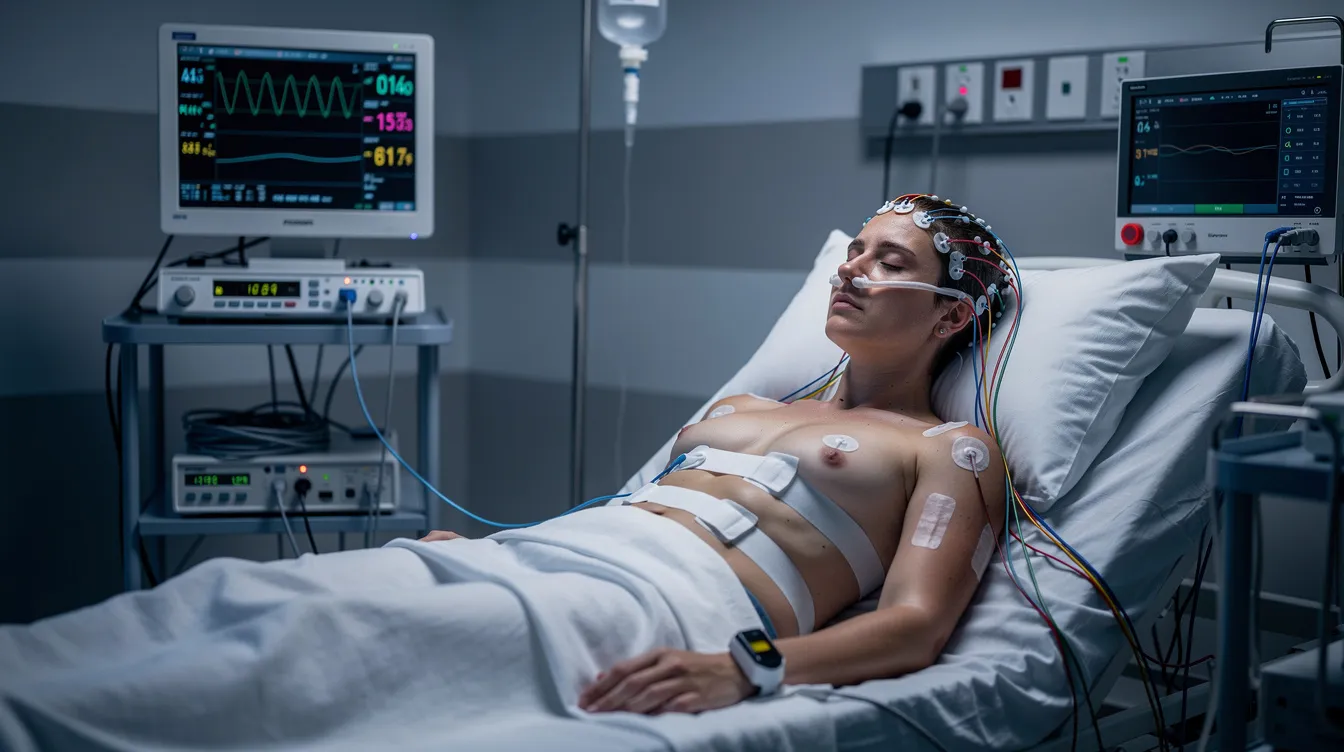
PSG deploys multiple monitoring systems:
- Electroencephalography (EEG) for brain waves
- Electrooculography (EOG) for eye movements
- Electromyography (EMG) for muscle atonia
- ECG, airflow sensors, and leg EMG
Sleep architecture components: Technicians score 30-second epochs into wake (W), N1 (low voltage mixed frequency), N2 (sleep spindles at 11-16 Hz), N3/slow wave sleep (delta power >75 µV), and REM stages. N1, N2, and N3 are collectively referred to as non rem sleep.
Normal sleep cycle structure:
- Cycles every 90-120 minutes
- REM: 5-25% of total sleep
- Light sleep (N1/N2): 45-55%
- Deep sleep (N3): 15-25%
Your wearable proxies this via movement cessation for N2/N3, HR slowdown for deep sleep, and variability for REM. It often conflates N1 with wakefulness and misses subtle arousals that lab PSG captures through direct cortical signals.
Validating Wearable Sleep Staging Against The Gold Standard

Wearable sleep stage accuracy – gold standard: polysomnography and sleep architecture
How do researchers determine if your device is accurate? They run validation studies comparing wearable output to simultaneous PSG recordings.
Epoch-by-epoch methodology: Researchers divide nights into 30-second segments and compute agreement percentages between the wearable and PSG for each epoch.
Key metrics:
- Sensitivity (true positive rate per stage)
- Specificity (true negative rate)
- Cohen’s kappa (accounting for chance agreement)
- 0.6 = substantial agreement
- 0.4-0.6 = moderate agreement
Typical study populations: Most studies involve 20-100 healthy adult participants aged 20-60, recorded overnight in-lab with simultaneous wearable and PSG monitoring. For example, a wearable might estimate three hours of deep sleep in a night, but PSG measurements often show a lower or different duration, highlighting the distinction between estimated and actual sleep stages. Home PSG kits like Withings Sleep Analyzer serve as controls in some independent reviews.
Reported Accuracy For Sleep Versus Wake And Sleep Stages
Multiple studies reveal consistent patterns in what wearables get right and where they struggle.
Sleep-versus-wake accuracy: Top devices like Oura Ring 4 and Garmin achieve 92-98% accuracy. This is the easy part—your tracker knows when you’re asleep. Devices detect ‘awake’ periods by monitoring movement and physiological signals such as heart rate variability and skin temperature; accurately identifying these ‘awake’ moments is crucial for comprehensive sleep analysis, as it helps distinguish true wakefulness from light or deep sleep.
Stage-specific accuracy ranges:
| Sleep Stage | Typical Accuracy | Common Issue |
|---|---|---|
| Light sleep | 70-85% | Overestimated (similar immobility to deep) |
| Deep sleep | 65-80% | Underestimated (minimal movement mimics wake) |
| REM sleep | 60-75% | Bursts resembling light sleep confuse algorithms |
Peer-reviewed validation examples:
- Oura Gen3: 79% overall agreement, kappa 0.62 (2021 Sleep Medicine study published)
- Apple Watch Series 9: 81% in Quantified Scientist tests
- Ultrahuman Ring Air: 82% overall agreement
- Huawei watches: < 70% in independent testing
REM Sleep, Light Sleep, and Deep Sleep: Stage-Specific Issues
Each sleep stage presents unique detection challenges for wearable devices.
Light sleep (N1/N2) physiological markers:
- Theta rhythms, K-complexes, and sleep spindles
- Mild heart rate drop
- Low but present movement
- Easily detected but often lumped with REM due to similar readings
Deep sleep (N3) physiological markers:
- Delta brain waves below 4 Hz
- Lowest heart rate (40-60 bpm)
- Highest HRV amplitude
- Near-zero body movements
Deep sleep is also critical for physical restoration and strengthening the immune system.
Wearables undervalue deep sleep without EEG access because short arousals go unnoticed—your tracker can’t see the brief cortical activations that technically interrupt this stage.
REM sleep detection challenges:
- Muscle atonia (stillness) combined with rapid eye movements
- Irregular heart rate elevated 5-10 bpm over deep sleep
- Phasic events inflate light sleep labels incorrectly
- Poor wrist PPG signal during atonia-induced vasoconstriction
Sleep Cycle And Sleep Architecture Implications
Staging errors compound across your night, distorting the sleep architecture your app displays.
How timing affects labels: Wearables often misalign stage transitions, compressing sleep cycles to 60-80 minutes or extending REM prematurely. A normal cycle should run 90-120 minutes.
Interpretation distortions: When 20% of deep sleep gets misclassified as light sleep, your profile skews toward “poor recovery.” This might prompt unnecessary interventions or create anxiety about sleep quality that doesn’t reflect reality.
Your device might show fragmented nights as “deep-poor” when you actually had normal sleep architecture.
Interpreting Sleep Data And Recognizing Sleep Patterns

Wearable sleep stage accuracy – rem sleep, light sleep, and deep sleep: stage-specific issues
Getting value from your tracker requires the right interpretation approach.
Focus on long-term trends: Prioritize 14-day averages of deep sleep percentage (aim for 15-20%) over single nights prone to 10-20% variance from positioning, stress, or minor illness.
Detecting consistent changes:
- Weekly REM drops below 20% may signal elevated stress
- Consistent heart rate variability declines correlate with recovery issues
- Sleep duration trends matter more than nightly fluctuations
Combine tracker data with a sleep diary: Note what time you went to bed, how long it took to fall asleep, any interrupted sleep, and how you felt in the morning. Trackers excel at detecting sleep onset latency (85% accurate) but can’t capture your subjective experience of rest.
Your sleep score reflects algorithmic estimates, not how rested you actually feel.
Choosing And Using A Sleep Tracker
Not all fitness trackers perform equally for estimating sleep stages.
Check independent validation: Look for devices reviewed by sources like The Quantified Scientist or referenced in peer-reviewed research. Manufacturer claims often overstate precision.
Prioritize comfort: Rings (Oura, RingConn) achieve 95% overnight compliance rates compared to bulkier watch designs. You can’t track sleep if the device wakes you up.
Prefer raw data export: Devices like Fitbit offer CSV exports enabling custom analysis. This reveals algorithmic biases and lets you compare trends across longer periods with your own methodology.
Improving Sleep Quality Using Tracker Data
Your tracker becomes useful when you translate data into action.
Use trends to set consistent bedtimes: Identify when your body naturally achieves 85%+ sleep efficiency and align your schedule accordingly. Track your chronotype patterns over two weeks.
Adjust lifestyle factors based on multi-night data:
- SpO2 dips across multiple nights warrant checking for altitude effects or apnea
- Consistent low deep sleep might indicate evening caffeine or alcohol patterns
- Low REM correlates with cognitive health impacts worth addressing
Avoid single-night optimization: Don’t chase stage maximization based on one night. A single-night deep sleep spike is often artifactual—positioning, sensor contact, or algorithmic quirks can produce misleading readings.
Limitations, Risks, And Ethical Considerations
Wearable sleep tracking comes with real downsides worth acknowledging.
Orthosomnia risk: Research suggests 10-20% of dedicated trackers develop anxiety from obsessing over “low deep sleep” scores. If monitoring your sleep makes it harder to fall asleep, the device is harming you.
Reduced accuracy in certain populations:
- Insomnia patients see kappa values drop to 0.3
- Shift workers experience poor staging due to irregular patterns
- Particularly those with sleep disorders often receive misleading data
Data privacy and security concerns: The 2025 Whoop data breach highlighted vulnerabilities in cloud-stored health data. Your sleep patterns reveal intimate details about your life—when you’re home, your stress levels, potential health conditions.
Marketing often overstates precision to non-clinical users. Your tracker cannot diagnose sleep disorders.
Future Directions In Wearable Sleep Staging
The next generation of devices aims to close the gap with clinical monitoring.
Multimodal sensors: Companies like Oura are exploring EEG earbuds, while non-contact radar technology (similar to Amazon’s discontinued Halo) could achieve 90%+ agreement without body contact.
Clinical workflow integration: FDA-cleared devices like Whoop MG are entering telehealth workflows. Researchers expect tighter connections between consumer data and doctor consultations.
Standardization efforts: 2026 IEEE papers call for standardized AASM validation protocols for consumer devices. This would let you compare accuracy claims across brands with confidence.
The future likely involves your tracker as an active participant in healthcare, feeding trend data to your doctor before appointments.
Practical Takeaways
Here’s your concise guidance for using sleep trackers effectively:
For everyday users:
- View your device as a trend coach, not a diagnostician
- Focus on week-over-week patterns, not nightly sleep stages
- Combine data with subjective experience—how do you actually feel each morning?
- Don’t let tracking create anxiety that prevents a good night’s rest
When to pursue clinical polysomnography:
- Persistent sleep duration under 6 hours despite adequate time in bed
- Daytime somnolence affecting work or safety
- Partner reports of breathing pauses or severe snoring
- Suspected sleep disorders not improving with lifestyle changes
Your wearable helps you understand patterns. Your doctor helps you understand problems. Know when each tool applies.

